CSDB usage: conformation maps
 |
Conformation data derived from molecular dynamics are stored together with model disacchrides. Currently high temperature MD simulation data from GlycomapsDB were used as a proof of concept. Conformation data for trisacccharides and bigger models are planned for the future. If a model compound does not have its own instance in CSDB, it is added as a virtual compound (i.e. without bibliographic reference).
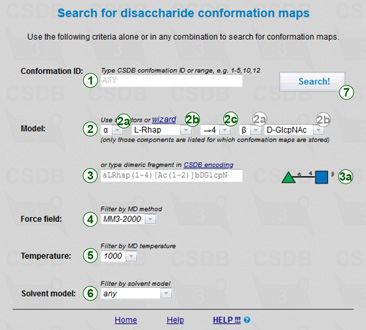
In the conformation search form (→) you are expected to input one or more criteria and press a button (7). Leaving all fields default displays all the contents of the conformation subdatabase.
Conformation ID allows the access to conformation maps using internal CSDB conformation identifiers enetred in field (1). Use commas to separate values and hyphens to specify ranges, e.g. 1,3,5-10.
Model is a disaccharide or its N-acetylated derivative. Conformation maps will be returned for the structures that have the specified model as a substructure. Default is ANY(?-?)ANY, an arbitrary dimeric fragment. To simplify the input of models (2), five drop-down lists are provided: lists of donor and acceptor residues (2b), their anomeric configurations (2a), and linkage position in the acceptor (2c). Only those donors and acceptors are listed, for which conformation maps exist in CSDB. The substitution positions at acceptor side are filtered according to substitutable atoms in the selected acceptor. The substitution position at donor side is set automatically to 1 or 2, depending on the selected donor residue (aldose vs. ketose). If a model of interest is not covered by selectors (2), you can use the structure wizard or input it directly in the field (3) in CSDB Linear notation. The model in previewed in SNFG format on the right (3a).
Strict modification search forces the strict comparison of residues regarding modifications (N- and O-acetylation, methylation, phosphorylation, etc.). For example, when checked, a search for Neu5Ac (ANY(?-?)[Ac(1-5)]aXNeup) will NOT return data on bonds to Neu5,9Ac.
Model size restricts the results to those obtained on a structure of a specified size. Three variants are possible: any (no limitations), disaccharide (exactly two residues, except small modifications), larger structures (three or more residues).
Selectors of a force field (4), MD simulation temperature (5), and solvent model (6) default to ANY (no limitations). They are mainly reserved for the future, as currently all the conformation maps were obtained under one of two condition sets: MM3-1996, 1000K, in vacuo (GlycomapsDB part), and MM3-2000, 300K, explicit Tip3P water (CSDB part).
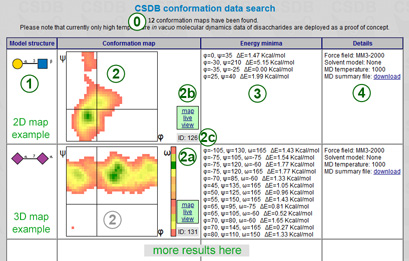 |
The number of found conformation maps (0) is reported in the header. The supported number of dihedrals is from one to three (+ 4D maps cannot be visualized but extremum lists and MD summary files can be downloaded). In this example (←), there is one 2D map (regular linkage) and one 3D map (linkage to exocyclic -CH2OH). The data are returned as a table containing four columns:
For 2D and 3D maps, a φ-ψ plot (2) is presented, and for 3D maps, there is an additional an ω-plot on the right (2a). Most common resolution is 10° along φ and ψ and 30° along ω. Black axii indicate zero lines. Abundance is encoded using a colors cale from red (low) to green (high) through yellow (middle). Hovering on a cell displays a number of frames populating this cell in the MD trajectory. White areas are unpopulated. Clicking on link (2b) displays a frame with interactive conformation explorer (see below) above the table and scrolls the page to the explorer.
The lower right corner displays an internal CSBD conformation ID (2c).
Conformation map explorer
 |
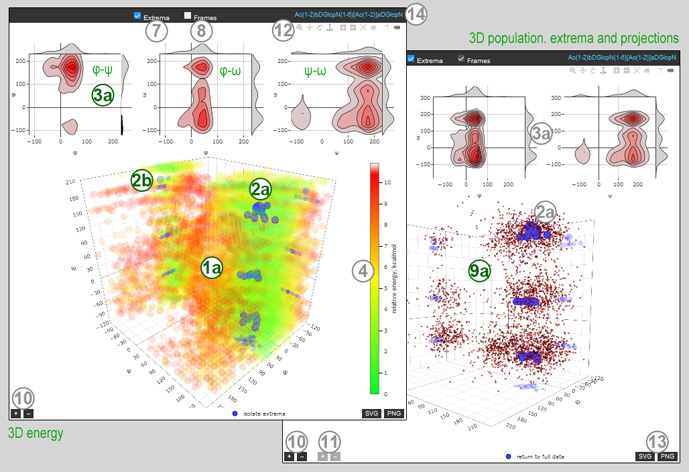 |
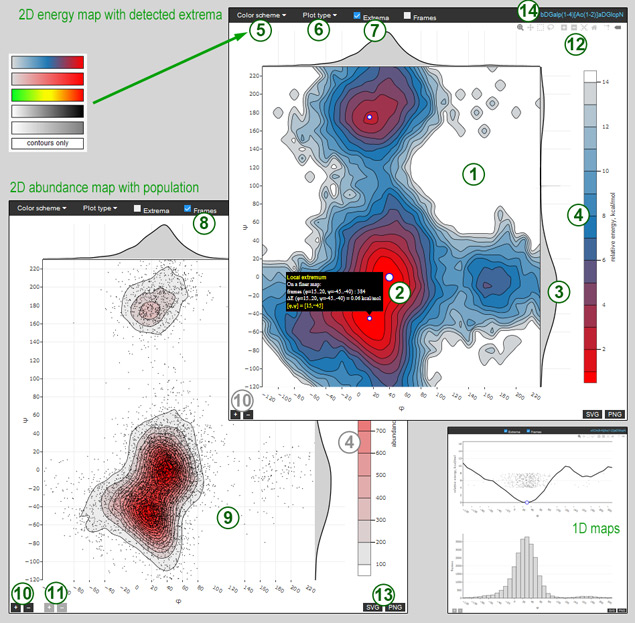
A vector map of interest can be further explored using this online tool, available for every row of the conformation data table. A toolbar (12) gives access to common operations: zoom, pan, orbital and turntable rotation (3D only), box select (2D only), toggle spikelines, reset. Default operations are zoom for 2D maps, and rotation for 3D maps. The map density (number of isolines on a 2D map, or size of energy bubbles on a 3D map) can be adjusted using dark-grey + – buttons (10) in the lower left corner.
A figure on the left (←) demonstrates a few views of a 2D and 1D maps, a figure on the right (→) shows two views of a 3D map. By default, an energy map (1, 1a) is displayed. A 2D map can be switched between energy and abundance using the Plot type selector (6), and the color scale legend (4) will change accordingly. A 3D map always shows relative energy. Hovering on a map shows the hovered cell details.
Maps are appended with projections: φ and ψ axii for 2D maps (3); φ-ψ, φ-ω, and ψ-ω planes together with axis projections for 3D maps (3a). Axis projections are updated on every change of a 2D map or 2D projection, plane projections can be panned and zoomed independently.
Each of the two 2D maps (energy and abundance) has a palette attribute which can be changed from Color scheme selector (5).
Chekbox Extrema (7) toggles the display of extrema. Extremum locations are depicted with white or blue circles (2, 2a). Extrema are derived from a finer map, and hovering on an extremum shows its details (cell size, abundance, relative energy). On 3D maps projections of extrema on the three coordinate planes are also shown. Clicking on isolate extrema below a 3D map will remove an energy map for clarity.
Chekbox Frames (8) toggles the display of individual MD trajectory frames as black dots on 2D maps (9) and small red balls on 3D maps (9a). The density of frames can be adjusted using light-grey + – buttons (11) in the lower left corner.
A current view of a map can be exported as vector (SVG) or high resultion raster (PNG) image using SVG PNG buttons (13) in the lower right corner.
The right side of a navigation bar shows the model in CSDB Linear notation (14) for reference.
Automated web-service (web API)
To search or retrieve conformational data in automated manner please use API at the following address: http://csdb.glycoscience.ru/database/core/search_conf.php?clean=1.
For clean parseable output clean parameter should be specified as GET only. If you use GET for other parameters, text data should be URL-encoded. The following parameters, can be passed via POST or GET:
| parameter | value | explanation |
|---|---|---|
| clean | 0 | 1 (GET only!) | 1 = clean text output (indication of web-API usage) |
| conf_ids | numbers, lists, ranges, e.g. 1-5,7,10 | retrieves conformation data with given IDs instead of search |
| lincode | string in CSDB Linear notation. | a bond to search conformation data for. Use double semicolon (;;) to separate multiple strings. A term can contain question marks, e.g. aDGlcp(1-?)?DGalp |
| model_size | 0 | 2 | 3 | the number of residues in resulting structures: 0 = no limitations; 2 = disaccharide; 3 = larger than disaccharide |
| strict_mva | 0 | on | if on, modifications of monosaccharides (e.g. acetates modifying aminosugars) are treated the strict way (e.g. GlcN means strictly GlcN, but not GlcNAc). If 0 (default), both modified and unmodified residues will be searched for. |
| compound_ids | numbers, lists, ranges, e.g. 1-5,7,10 | search among the specified CSDB compound IDs only |
| method | MM3-1996, MM3-2000 | simulaton method. Empty means no limitations. |
| temperature | 300, 1000 | MD temparature in Kelvin. Empty means no limitations. |
| solvent | None, Tip3P | solvent model. Empty means no limitations. |
The service returns a list of URLs to MD summary files, one result per line. On error, it returns one error message per line. Empty result means that no results were found with the specified search criteria. MD summary file is an XML-wrapped conformation map, structure, simulation conditions, meta-data, and comments. The data arrangment and field names are self-explanatory (see example).
Example. Test it using GET: http://csdb.glycoscience.ru/database/core/search_conf.php?clean=1&temperature=300&lincode=bDGlcpN(1-2)aDManp
GET input (example):
lincode=bDGlcp(1-?)aDGalp temperature=300 clean=1 |
=> |
Web-service output (3 results found):
<HTTP headers> http://csdb.glycoscience.ru/jsmol/confmap_data/minima/330a43610dd738ae07c164faca282ad6b8ac82d1.xml http://csdb.glycoscience.ru/jsmol/confmap_data/minima/0e18df510147070e03467f0757a9d21fae1eb094.xml http://csdb.glycoscience.ru/jsmol/confmap_data/minima/3ead7f7d4f79457d45fc0d19167fed5b9afee9de.xml |
Home