This section describes tools for statistical analysis and clusterization based on the CSDB content. These features are available from the Extras section of the menu. For basic help, refer to the CSDB usage help.
|
Contents
|
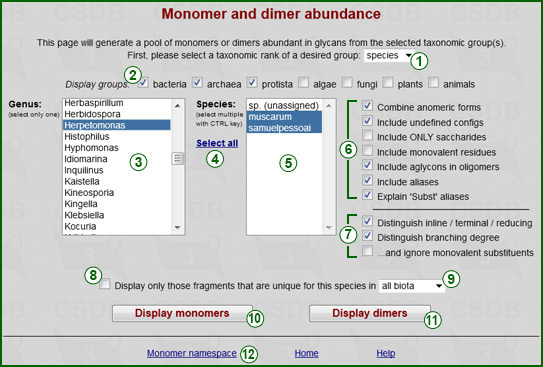
This feature provides the distribution of monomeric or dimeric fragments in structures from specified taxonomic group(s) and data on their uniqueness and location in the structures.
Rank selector (1) determines the rank of taxa to analyze: Domain, Phylum, Class, Genus, Species (exemplified on the screenshot) or Strain. Depending on the selected rank, the taxa available in the database are displayed as list (5). For domains, no lists are displayed, and domains can be selected using the Display groups checkboxes (2). For other ranks, Display groups filter the taxa to those included in the checked domains only. For species or strains, an additional list of genera (3) is provided for easier selection. As soon as a genus is selected, the list of species or strains (5) is updated. For every rank lower than domain, multiple selection is allowed with the Ctrl key. To select the entire list of taxa, press the Select all link (4).
Option group (6) determines which fragments will be included in the statistics:
Option group (7) determines whether the position of fragments in a structure is distinguished:
Checking box (8) limits the results only to those fragments, which are unique for selected taxa. The scope of the uniqueness analysis is defined by upper-group rank selector (9). Allowed variants are all biota (unique among all structures in the database), its kingdom (unique within the domain the selected taxa belong to) and its phylum (unique within the phylum the selected taxa belong to). Depending on the selected taxon rank (9), some options in the upper-group rank selector may be disabled.
The Monomer namespace link (12) displays the list of monomers present in the database, abundance data on their various forms and residue properties.
The buttons run the query for monomers (10) or dimers (11) to display the result page (screenshot for a sample query is on the right).
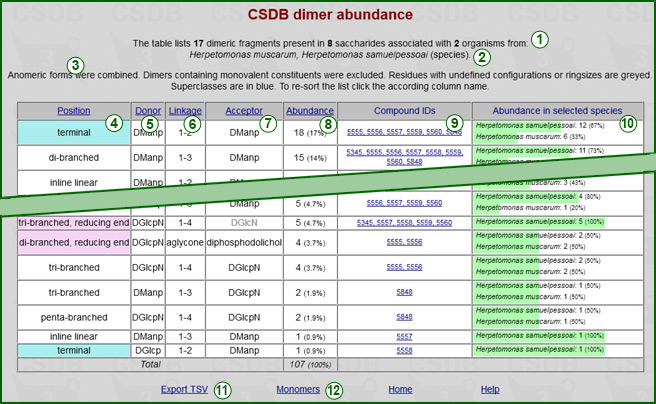
On the result page, the header displays the cumulative data on the generated statistics (1) and the list of selected taxa and their rank (2). The restrictions used to pick up the fragments are overviewed below (3).
The table of results includes the following columns:
Clicking on any of the column headers (4)-(8) resorts the table in the selected column. By default, the table is sorted by the descending abundance.
The accessory link Export TSV (11) exports the results as tab-separated values for copy-pasting into Microsoft Excel or other table software. The accessory link Monomers or Dimers (12) runs the same query for fragments of the other size (one or two residues) than those present in the table.
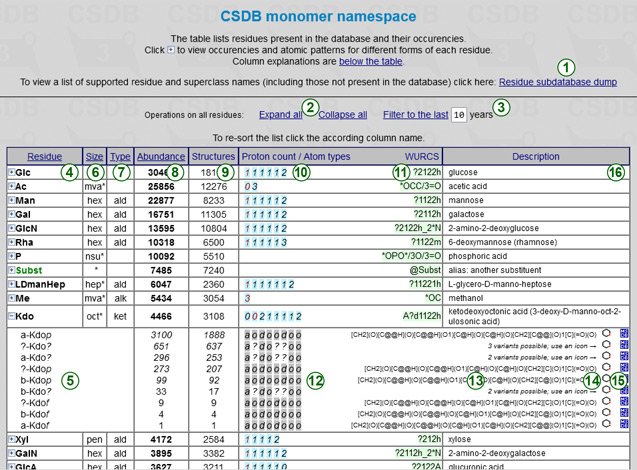
The monomer namespace table provides information on the naming and properties of residues, of which all structures in the database are composed. You can use this data to check the spelling of names when typing queries in CSDB Linear notation, to check the properties/structure/forms of a certain residue, or to check that a residue of interest is supported by CSDB engine.
Only the residue having at least one occurence in structures in the database structures are listed, one per row.
The link Residue subdatabase dump (1) displays flat data on all residues parseable by the CSDB engine (not only those present in structures in the database). For more details on the residue names, please refer to Structure encoding, section 2.
Clicking on an appropriate column header resorts the table alphabetically (default), by residue properties or by abundance. Brief explanation of columns and values is provided at the page bottom.
Every residue name can be expanded by clicking on + to view the abundance-decreasing list of anomeric, absolute and ring size forms in which the residue is populated (5). The links Expand all and Collapse all (2) in the page header expand or collapse all residues in the table, and the year filter (3) restricts the output to residues present only in structures reported in the recent years, as specified. When expanded, every form of the residue has its own columns:
Atomic pattern (12) is a characteristic of atoms in the residue, sorted by ascending carbon numbers from left to right. Every atom is represented by a single character: o = >CH-OH (hydroxy) or -CH(OH)2 (dihydroxy), n = >CH-NH- (amino), a = -COOH or -XOnOH, e.g. phosphate (acid), d = -CH2- or >CH- or >C< (deoxy), D = -CH= or >C= (deoxy sp2) or tertiary sp-C, O = -C(OH)= (hydroxy sp2), N = -C(NHR)= (amino sp2) or -CONH2 (amide), A = -CHO or -C(OH)2 (carbon able to form a hemiacetal), x = other carbon (>C=N-, etc.), ? = any (in superclasses), or unclear due to indefinite ring size configurations, or yet unknown.
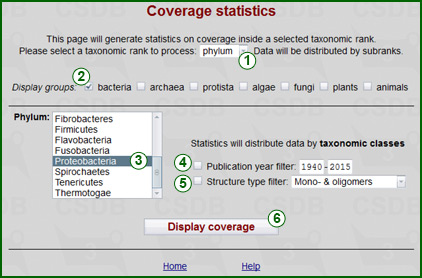
This tools displays database coverage data for a given taxonomic group. The rank of this group can be selected using rank selector (1). Allowed ranks are all biota (no limitations, default), domain, phylum, class and genus. As soon as the rank is selected, the list of matching taxa (3) is shown or updated according to domain filter (2). For kingdoms, the domain filter is used as a selector. Please note, that although all domains have checkboxes, there is no sense in checking domains beyond the scope of the database (bacteria, archaea and protista in Bacterial CSDB; plants and fungi in Plant&Fungal CSDB).
Publication year span checkbox (4) filters results to those published within the specified range only. Structure type checkbox (5) filters results to those containing structures of the specified type only (mono- and oligomers, all polymers, monomers and homopolymers, cyclic polymers or biological repeating units). The Display coverage button (6) processes the query.
Results are presented as a table containing the following columns:
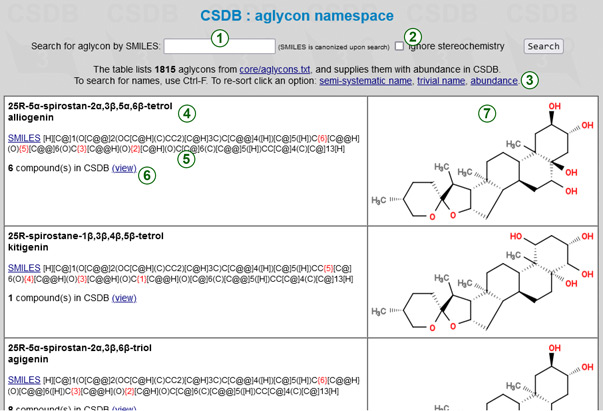
The aglycon namespace table provides information on the naming and properties of populated aglyca present in CSDB structures. A few most abundant aglyca can be encoded in CSDB Linear notation using a dedicated residue name, while the majority of others uses Subst alias syntax and a SMILES code. You can use this data to check the spelling of aglycon names, to retrieve their SMILES codes, and to find the matching structures in CSDB. As any aglycon can be encoded in SMILES, the absence of a particular entry in this table does not mean that an aglycon is not supported. Normally, small aglyca (<12 carbons) are omitted from this table unless they are highly populated or have a critical role.
Every aglycon is presented in one row. The left cell lists the semi-systematic and trivial (if exists) names (4), a SMILES code (5) with substitutable positions added before corresponding carbons in red square brackets, abundance in CSDB (count of structures) (6), and a CSDB Linear residue name, where it exists. To copy a clean SMILES without linkage marks, click on SMILES link before the code. Clicking on a view link opens a list of CSDB structures containing this aglycon, so you can use it to search for glycoconjugates by aglycon.
The right cell displays structural formulas of aglyca. To find an aglycon of interest by name, please use the text search function of your browser. To find it by SMILES, a search form (1) is provided above the table. You can use SMILES in any form (canonical form is not mandatory), and the search term will be automatically canonicalized. Taking into account possible inaccuracies in aglycon specification both in articles and databases, a search strictness can be lowered by checking the Ignore stereochemistry flag (2). When checked, all aglyca matching the specified atom connectivity are returned, ignoring the stereo-configuration of atoms. The search for aglyca by a partial (sub)structure is not supported.
To resort the table alphabetically (by semi-sustematic or trivial names) or by abundance in CSDB, please use one of the links (3).
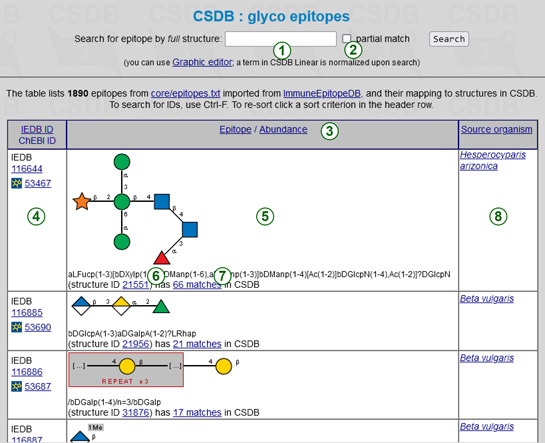
The glycoepitope list maps carbohydrate-containing epitopes from the Immune Epitope Database to the structures in CSDB.
To search for a certain IEDB ID or ChEBI ID, use a text search in your browser (Ctrl-F, etc.). To find a glycoepitope by full or partial structure, please use the search field (1). A (sub)structure should be specified in the CSDB Linear notation. The question marks can be used for unknown configurations, ring sizes, or linkage positions; alternative branches and superclasses are supported for the ambiguous monomer identity. You do not have to worry about the side chain ordering, as the structure is automatically normalized upon search. For non-experts in CSDB notation, an SNFG-style graphic editor is available (a link below the search field). On closing, it returns the structure in CSDB Linear to a search window, where it can be further edited. By default, a search term is matched to the full structures of glycoepitopes, as they are deposited in IEDB. Checking the checkbox Partial match (2) extends the results to all epitopes containing this fragment as a substructure.
The epitopes are displayed in a table in the following columns:
Clicking on a table header row (3) changes the sorting mode: by ID, by CSDB Linear code alphabetically, by the abundance in CSDB, or by a biological source.
Every time a structure is displayed in the expanded CSDB output, it is supplemented by a list of glycoepitopes that it contains. Clicking on this list opens a part of the glycoepitope table matching the possible fragments of this particular structure.
This feature generates a distance matrix between mono- or dimeric fragment pools from taxa populated in both the (bacterial and plant&fungal) databases. Based on this matrix, the taxa are clustered into groups, and the corresponding dendrograms are displayed. The exported matrix can be used for clustering of taxa according to the glycans they biosynthesize, can be visualized as phenetic trees or processed externally.
At first, the program generates a list of taxa, in accordance with the specified constraints (Scope settings and General settings), and a list of structural fragments that will be included in the analysis, in accordance with the specified constraints (General settings and Fragment pool settings). Having these two lists prepared, the program builds binary occurrence codes that reflect the occurrence of particular fragments in structures assigned to organisms belonging to every taxon under analysis. These occurrence codes are compared to give Hamming distances between taxa, which are normalized by the exploration degree of the two taxa being compared (how many structures are assigned to them). These distances form a dissimilarity matrix used for cluster analysis of taxa and building of phenetic graphs.
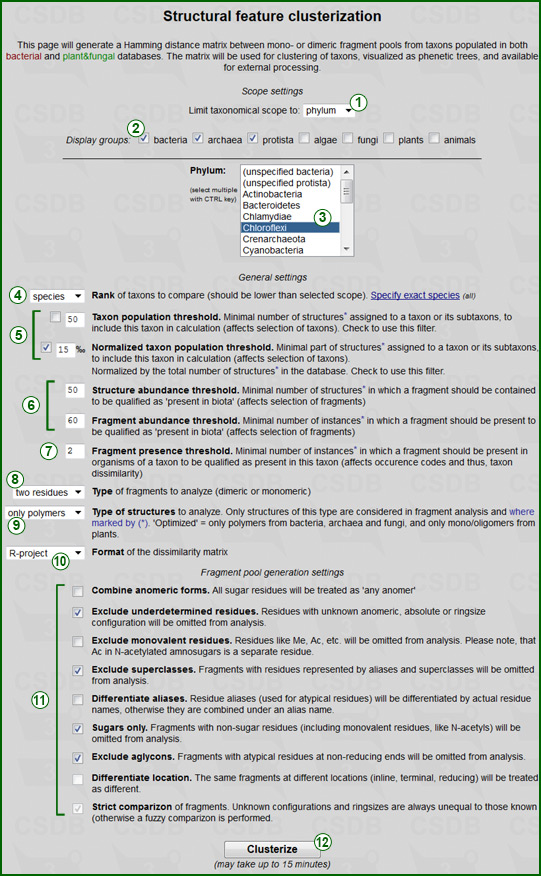
GENERAL SETTINGS include options and thresholds for the generation of the taxon list, fragment list and occurrence codes:
SCOPE SETTINGS allow processing of the analysis inside a particular taxonomic group, which affects the selection of taxa. This taxonomic group may include one or more taxa selected in the taxon selector (3). The group-rank selector (1) switches this list (3) to the desired rank and updates its content according to both databases combined. Allowed ranks are All biota (no limitations), Domain, Phylum, Class and Genus. This rank has sense only if it is higher than the rank of taxa for analysis selected in general settings (4). Group filter (2) limits list (3) only to those taxa that belong to the checked domains. Multiple taxa can be selected with the Ctrl key. The taxa for the analysis will include only subtaxa of the taxa specified in the scope settings.
FRAGMENT POOL SETTINGS (11) include options for generation of the fragment list and are analogous to those used in the Fragment abundance tool:
Pressing the Clusterize button (12) runs the analysis. The specified restrictions affect the total number of processed taxa and fragments, so the calculation may take from 30 seconds to 15 minutes.
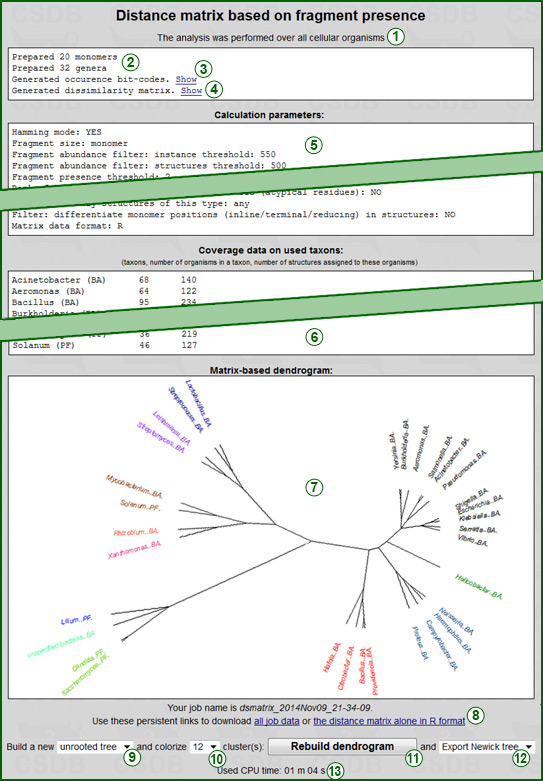
When the analysis is done, the results are displayed (an example is shown on the right screenshot). They start with an overview of the taxonomic scope (1) (on which supergroup(s) of organisms the data were obtained). Reports on the number of generated fragments of the desired size and on the number of generated taxa of the desired rank (2) indicate that taxon and fragment pools were prepared without errors.
The occurrence bit-code generation report (3) includes the Show link that displays a table with the taxa and their bit-codes, as well as a separate list of the used fragments. For easy correlation, bits in the occurrence codes and fragments in the list are split in groups of five and have the same order. The dissimilarity matrix generation report (4) also has the Show link that displays the distance matrix in the selected format.
Next two blocks show a copy of the Calculation parameters (5) used in the analysis and Coverage data on used taxa (6). The latter data are displayed in a tab-separated table with taxon names and database markers ((BA) = bacterial, (PF) = plant&fungal), a number of organisms within a taxon and its subtaxa (second column), and a number of structures assigned to these organisms (third column).
If the dissimilarity matrix format was chosen as R-project, a dendrogram reflecting the results of clustering (7) and additional options (9)-(12) are displayed. Regardless of the matrix format, the analysis results (except a dendrogram tree) are stored on the CSDB server in two files referenced by persistent links (8). The first (TXT file) contains the dump of the input parameters, generated dissimilarity matrix and coverage data on taxa. The second file (data in the specified format) contains the dissimilarity matrix alone, for processing in other software. If you need these files, please copy the links or the job name and use them within six months, or download the files.
For R-formatted matrices, additional options are available to rebuild a dendrogram from the same dissimilarity matrix without re-running the analysis. Graph type selector (9) specifies the dendrogram type: Phylogram (rectangular stems), Cladogram (angular stems), Unrooted tree (as on the screenshot) or Circular tree (with the root in the center). The leafs (=taxa) of the built phenetic tree are colored according to the number of largest clusters specified in selector (10). The button Rebuild dendrogram (11) updates image (7) and exports the phenetic tree in the format chosen by selector (12). Allowed formats are No export (default), Newick tree and Nexus tree. After the export, a link to the corresponding file appears in link area (8). The image update process opens another browser window, and if there were no errors, it is closed automatically after the image is refreshed.
The CPU time needed for calculation (13) is provided for reference.
The Disease statistics displays medical annotations of CSDB records in three sections:
You can sort all three lists alphabetically of by abundance in CSDB by clicking on a corresponding column header. All data can be filtered by a taxonomical domain (a drop-down selector at the age top). This domain refers both to the disease-associated organism itself and to host organisms infected by an organism. E.g., selecting Prokaryotes will display 'cell wall' (an organ in bacteria) and 'kidney' (an organ in the host organism); selecting Fungi will show diseases of fungi themselves, and fungal phytoinfections as well.
The Journal statistics maps journals supported by CSDB bibliographic engine to IDs in the National Library of Medicine catalog (NCBI NLM IDs). Besides NLM IDs, standardized titles and abbreviations, the table lists latest publishers, and occurence in CSDB (the number of publications in this journal). Where this number is zero, it means that a journal is recognized and supported by the CSDB engine, but there are no publications in this journal, asociated with any structures in the CSDB. You can sort the list by journal name, publisher, or occurrencies by clicking on a corresponding column header.
The second table in this page provides simiar information on non-periodic books, symposium proceedings, and other sources that do not have an NLM ID.